Plot rice fields with invertebrate mass production
ff_plot_inv_mass.RdPlot all fields showing their calculated invertebrate mass production (based on acreage). The ff_calc_inv_mass function is first run on the ff_fields dataset using the defined number of days. Displays the watersheds, return points, and waterways on the basemap.
ff_plot_inv_mass(
  day = 1,
  filename = NULL,
  width = NULL,
  height = NULL,
  units = NULL,
  colors = NULL,
  direction = 1
)
Arguments
- day
The day number for which to calculate the invertebrate mass. Defaults to one day.
- filename
File name to create PNG image on disk. Optional if saving the plot is desired.
- width
Plot width in
units. If not supplied, uses the size of current graphics device.- height
Plot height in
units. If not supplied, uses the size of current graphics device.- units
Units used for the width and height ("in", "cm", "mm", or "px"). Uses default
ggplotdpi settings for resolution.- colors
Color palette to use. Choose from either a character string indicating the
viridiscolor map option to use (listed below), or a named vector defining a custom continuous gradient withlowandhighor a diverging gradient withlow,mid, andhigh, e.g.colors = c(low="red", mid="white", high="blue"). For the diverging gradient, the average value is used as the midpoint.magma(orA)inferno(orB)plasma(orC)viridis(orD)cividis(orE)rocket(orF)mako(orG)turbo(orH)
- direction
If using one of the
viridisscales for thecoloroption, sets the order of colors in the scale. If 1, the default, colors are ordered from darkest to lightest. If -1, the order of colors is reversed.
Examples
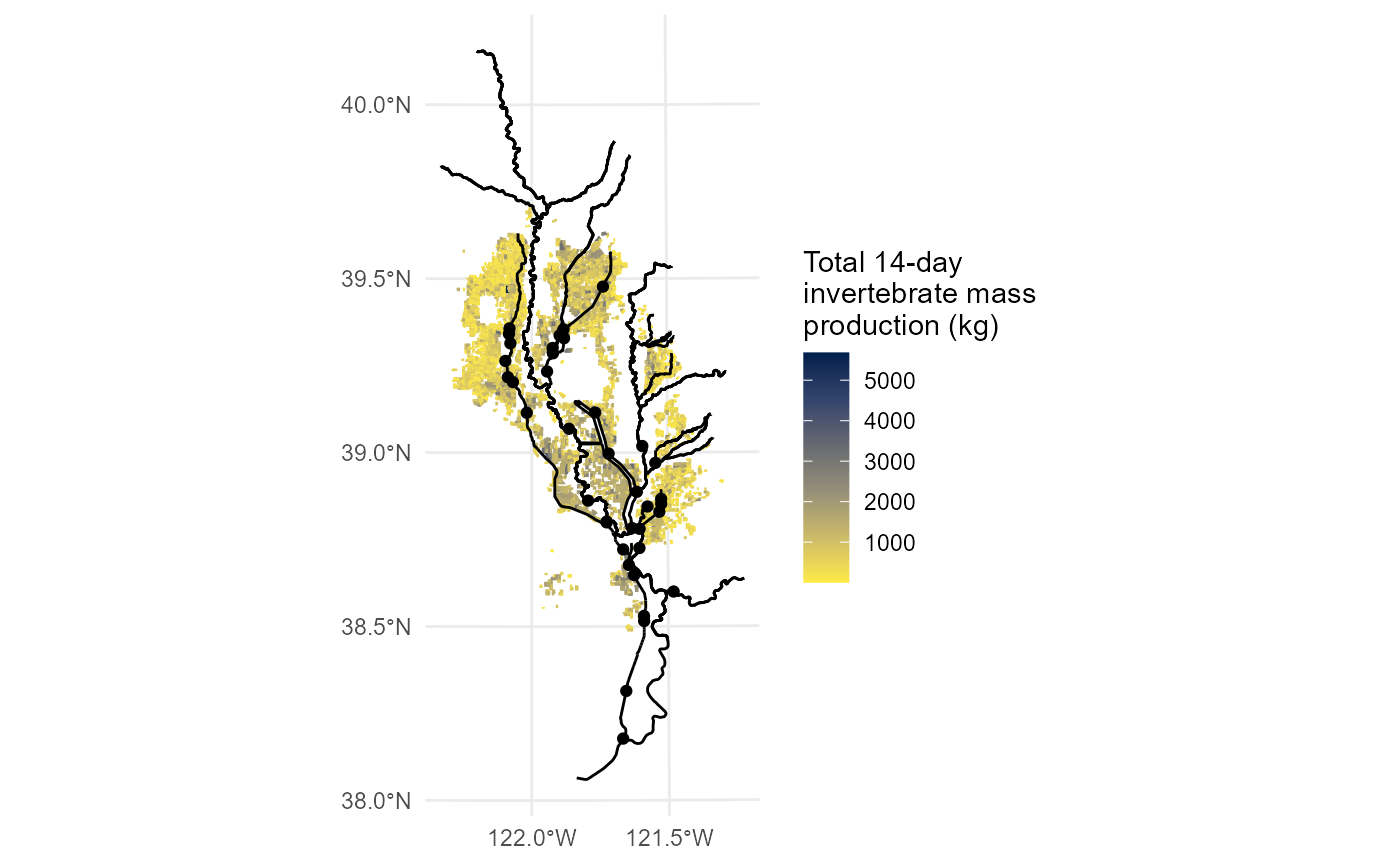
ff_plot_inv_mass(14)
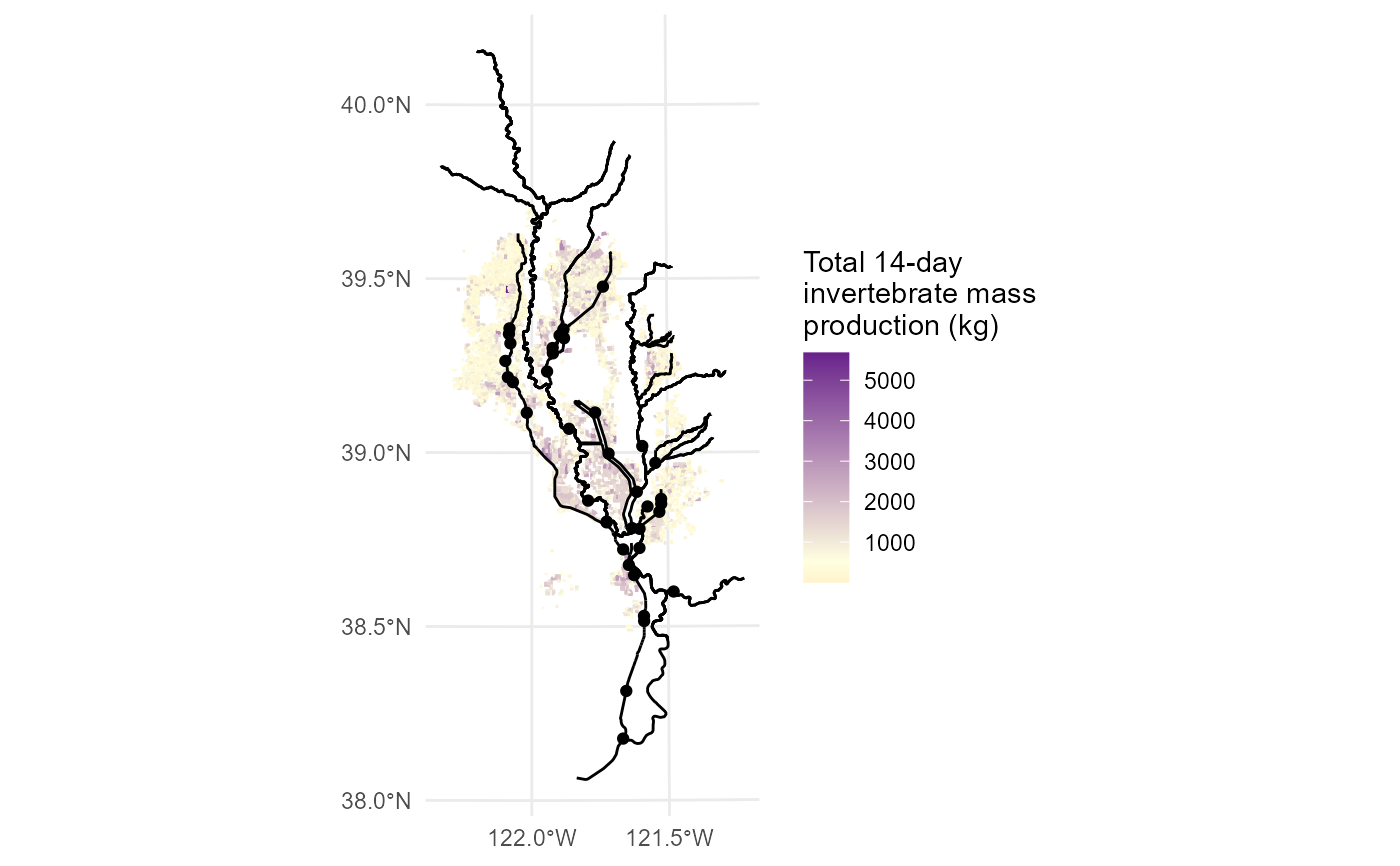
 # Choose custom colors
ff_plot_inv_mass(14, colors=c(low="darkorange", mid="lightyellow", high="darkorchid4"))
# Choose custom colors
ff_plot_inv_mass(14, colors=c(low="darkorange", mid="lightyellow", high="darkorchid4"))
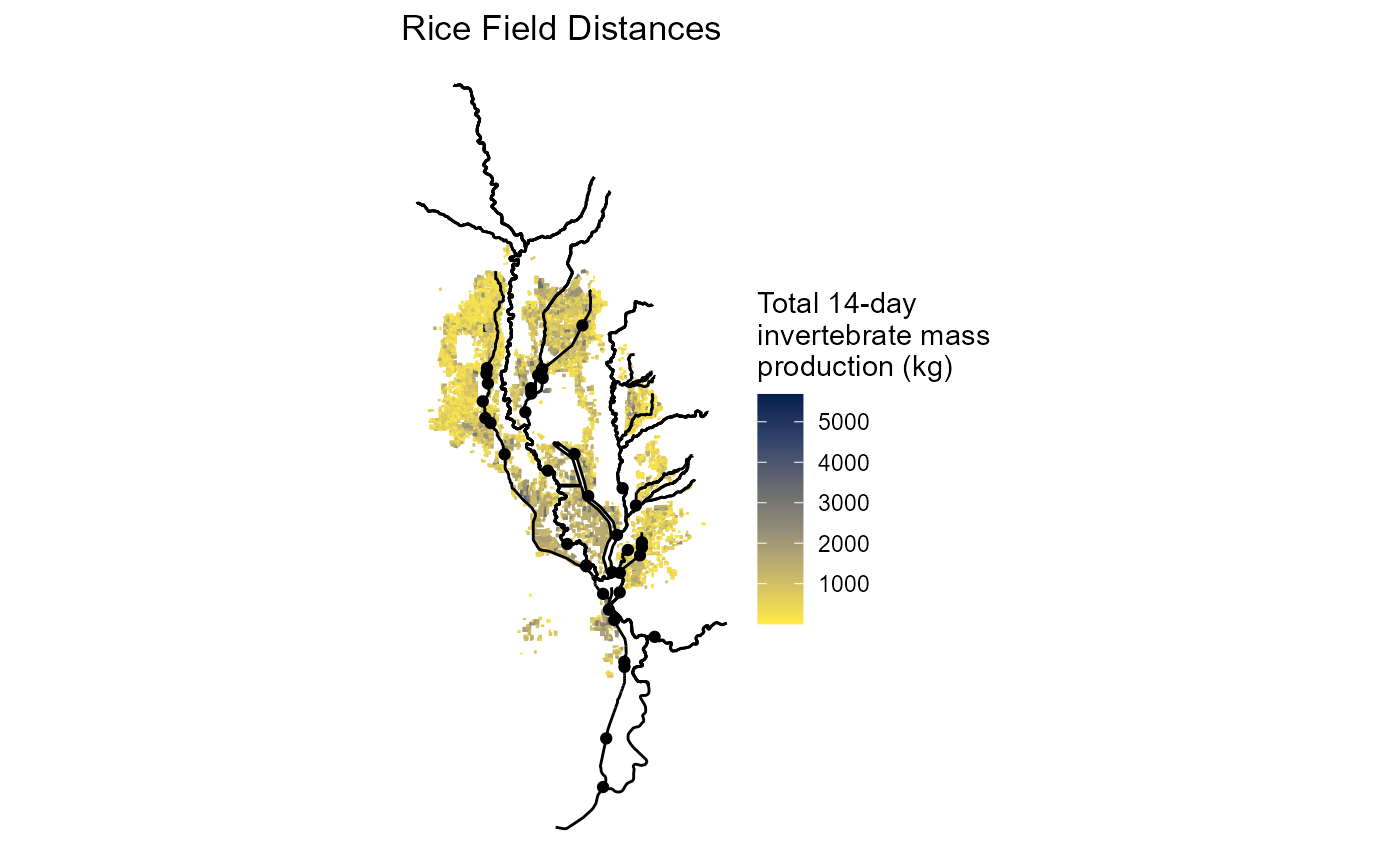
 # Returns a ggplot object that can be chained to additional ggplot functions
ff_plot_inv_mass(14) + ggplot2::ggtitle("Rice Field Distances") + ggplot2::theme_void()
# Returns a ggplot object that can be chained to additional ggplot functions
ff_plot_inv_mass(14) + ggplot2::ggtitle("Rice Field Distances") + ggplot2::theme_void()