CDEC Overview Document
cdec_template.RmdCDEC Summary
The California Data Exchange Center (CDEC) is a consolidated interface for hydrologic and climate data collected by multiple agencies across the state of California, reporting historic and real-time streamflow, stage, precipitation, snowpack, reservoir level, temperature, water quality, and more.
- Source: California Department of Water Resources (DWR), aggregating hydrologic datasets from many sources including counties, water districts, CDFW, NPS, USFS, USGS, USACE, and DWR itself.
- Accessibility: Public, open and accessible online
- Coverage: State of California, where data is available
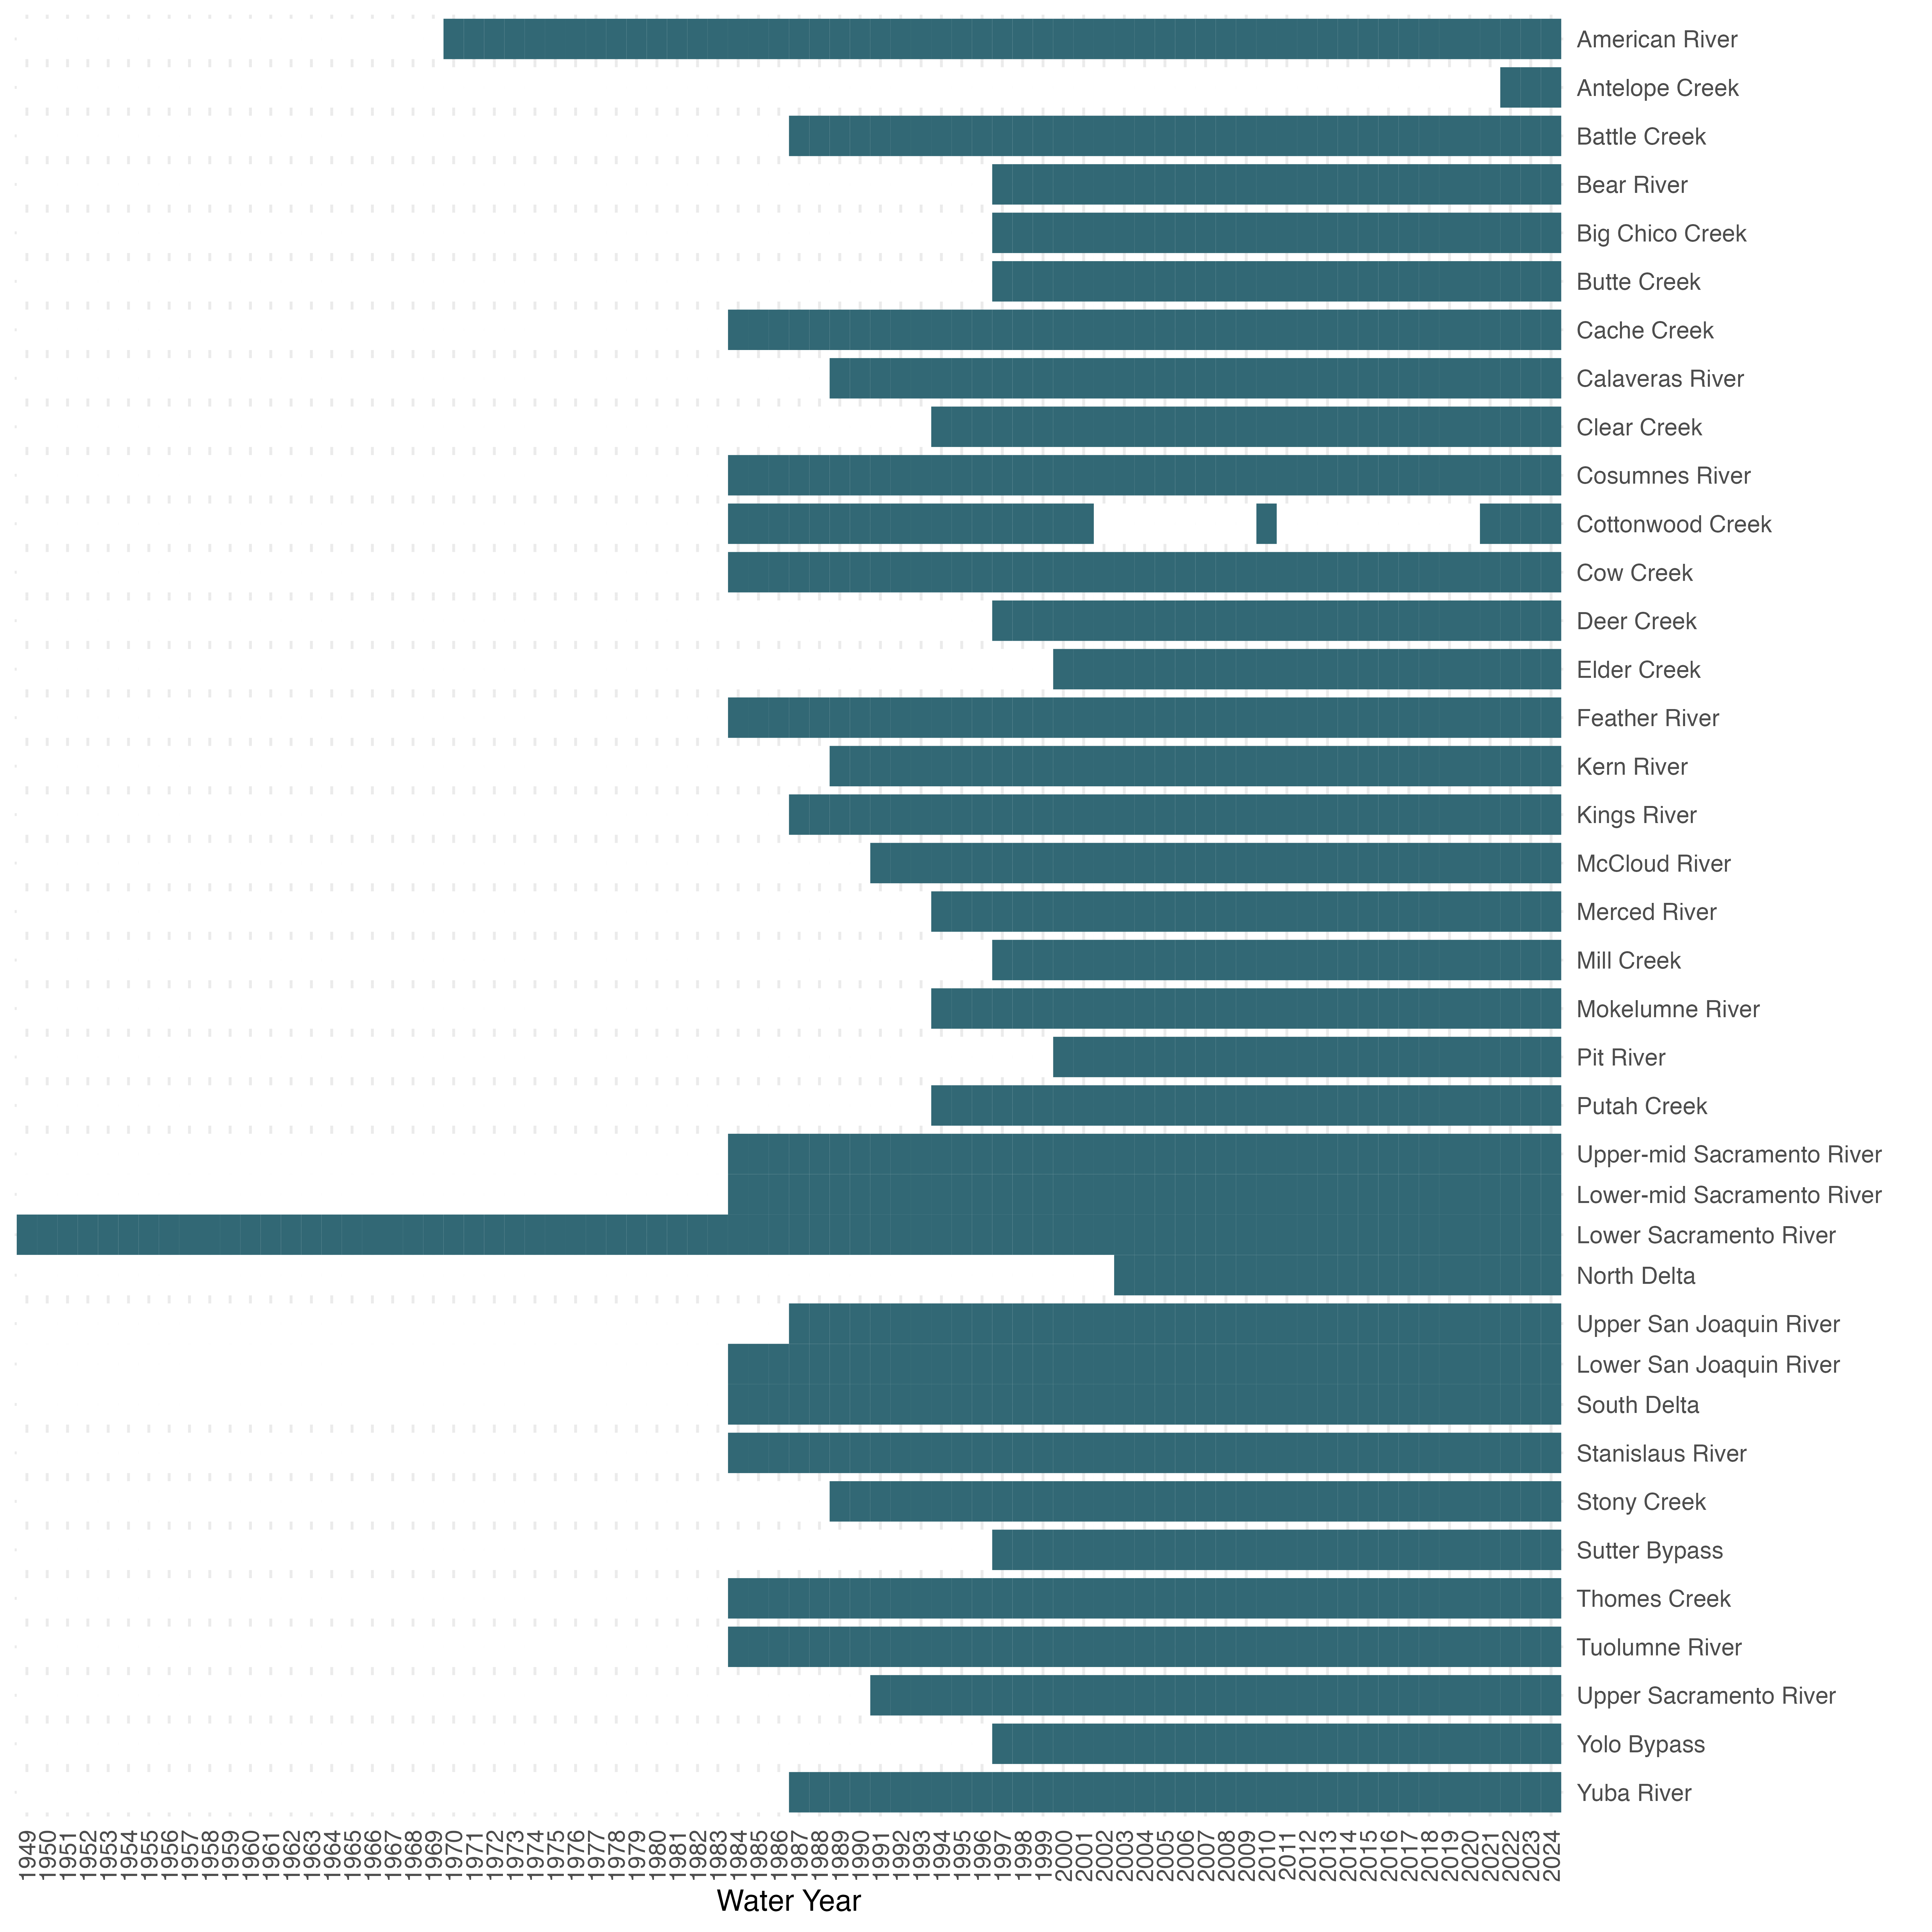
- Temporal Coverage: Max temporal range is 1949-present. The Lower Sacramento River has data back to 1949 and the American River back to 1970. 35% of reaches have data from 1984 or earlier. 75% of reaches have data for 1997 or earlier. 90% of reaches have data from 2015 or earlier.
- Spatial Coverage: 37 of 40 tested reaches have data available. Reach definitions are the 34 SIT reaches (including Yolo Bypass and Sutter Bypass) plus the western Delta tributaries (Putah Creek and Cache Creek), major Tulare Basin rivers (Kings River and Kern River), and major upper Sacramento basin rivers (McCloud River and Pit River).
- Maintenance: Each gauge has a maintaining agency which may or may not include DWR. CDEC staff will report issues and forward maintenance requests to the relevant agency. Level of maintenance likewise varies by gauge.
- Contact: General CDEC contact:(916) 574-1777 / DWR contact form; specific gage data contacts depend on which organization/agency is responsible for maintaining the gage.
- Utilized By: CDEC data is the definitive source of public hydrologic data for water resources work in California, and is used as inputs to countless models, studies, dashboards, and reports.
Data Access
Parameters
Stations
Station IDs follow a 3-character alphanumeric format. When the ID is known, the station metadata can be looked up using the following URL pattern:
https://cdec.water.ca.gov/dynamicapp/staMeta?station_id={XXX}
CDEC has an station locator map located at https://cdec.water.ca.gov/webgis/?appid=cdecstation
Stations can also be queried by river basin. For the greater Sacramento-San Joaquin basin, this includes the following river basins:
## AMERICAN RIVER, BATTLE CREEK, BEAR RIVER, BUTTE CREEK, CACHE CREEK, CALAVERAS RIVER, COSUMNES RIVER, COTTONWOOD CREEK, DELTA, FEATHER RIVER, KERN RIVER, KINGS RIVER, MC CLOUD RIVER, MERCED RIVER, MOKELUMNE RIVER, PIT RIVER, PUTAH CREEK, SACRAMENTO RIVER, SACTO VLY NE, SACTO VLY WEST, SAN JOAQUIN FLOOR, SAN JOAQUIN RIVER, SAN JOAQUIN VLY WEST, STANISLAUS RIVER, STONY CREEK, TUOLUMNE RIVER, YUBA RIVERSensors
Refer to the station ID for which sensors are available at a particular station.
Following are the sensor codes that report some variation of flow in cfs. There are many other codes not listed here including stage, temperature, turbidity, etc.
-
20= FLOW = FLOW, RIVER DISCHARGE, CFS -
41= MFLOW = FLOW, MEAN DAILY, CFS -
110= DIVERSN = FLOW, CANAL DIVERSION, CFS -
23= OUTFLOW = RESERVOIR OUTFLOW, CFS -
76= INFLOW = RESERVOIR INFLOW, CFS -
7= REL SCH = SCHEDULED RELEASE, CFS (manually reported) -
210= AUXFLOW = FLOW AUX, CFS -
165= FLOW.XX = FLOW, RIVER DISCHARGE PRECISE, CFS (rarely used) -
8= FNF = FULL NATURAL FLOW, CFS (modeled)
This report’s analysis of spatial and temporal coverage includes
sensors for in-stream flow (20, 41) that
monitor the full mainstem channel flow for selected major rivers and
creeks. Side channels and diversions are not included. Reservoir
outflows of the major Central Valley rim dams are also included as flow
data for their associated rivers.
Durations (timesteps)
A particular station sensor will have data available at one or more of these duration types. The station lookup page will describe which sensor-duration combinations are available.
-
E= EVENT (typically 15-minute intervals) -
H= HOURLY -
D= DAILY
For example, BCK
has flow data (sensor 20) available at the 15-minute
(duration E) and hourly (duration H)
timesteps, as well as in a summarized daily mean format (sensor
41, duration D).
Data Access Options
CSV web service
Data can be queried in CSV format using the following URL template, including the 3-digit station ID, the sensor and duration codes described above, and the start and end dates.
https://cdec.water.ca.gov/dynamicapp/req/CSVDataServlet?Stations={XXX}&SensorNums={XX}&dur_code={X}&Start={YYYY-MM-DD}&End={YYYY-MM-DD}
Web API
Data can be queried via the CDEC API. This is documented in PDFs linked at https://cdec.water.ca.gov/queryTools.html
Visual Interface
Real-time, daily, monthly query options are available at the following link: https://cdec.water.ca.gov/queryTools.html
An alternate interface allows the user to query the most recent data by each sensor, listed out for an entire river basin: https://cdec.water.ca.gov/dynamicapp/getAll
R package CDECRetrieve
FlowWest developed the R package CDECRetrieve for
querying CDEC data. This package is documented at https://github.com/FlowWest/CDECRetrieve
and can be installed via:
Spatial & Temporal Coverage
The following section assesses spatial and temporal coverage of the stations.
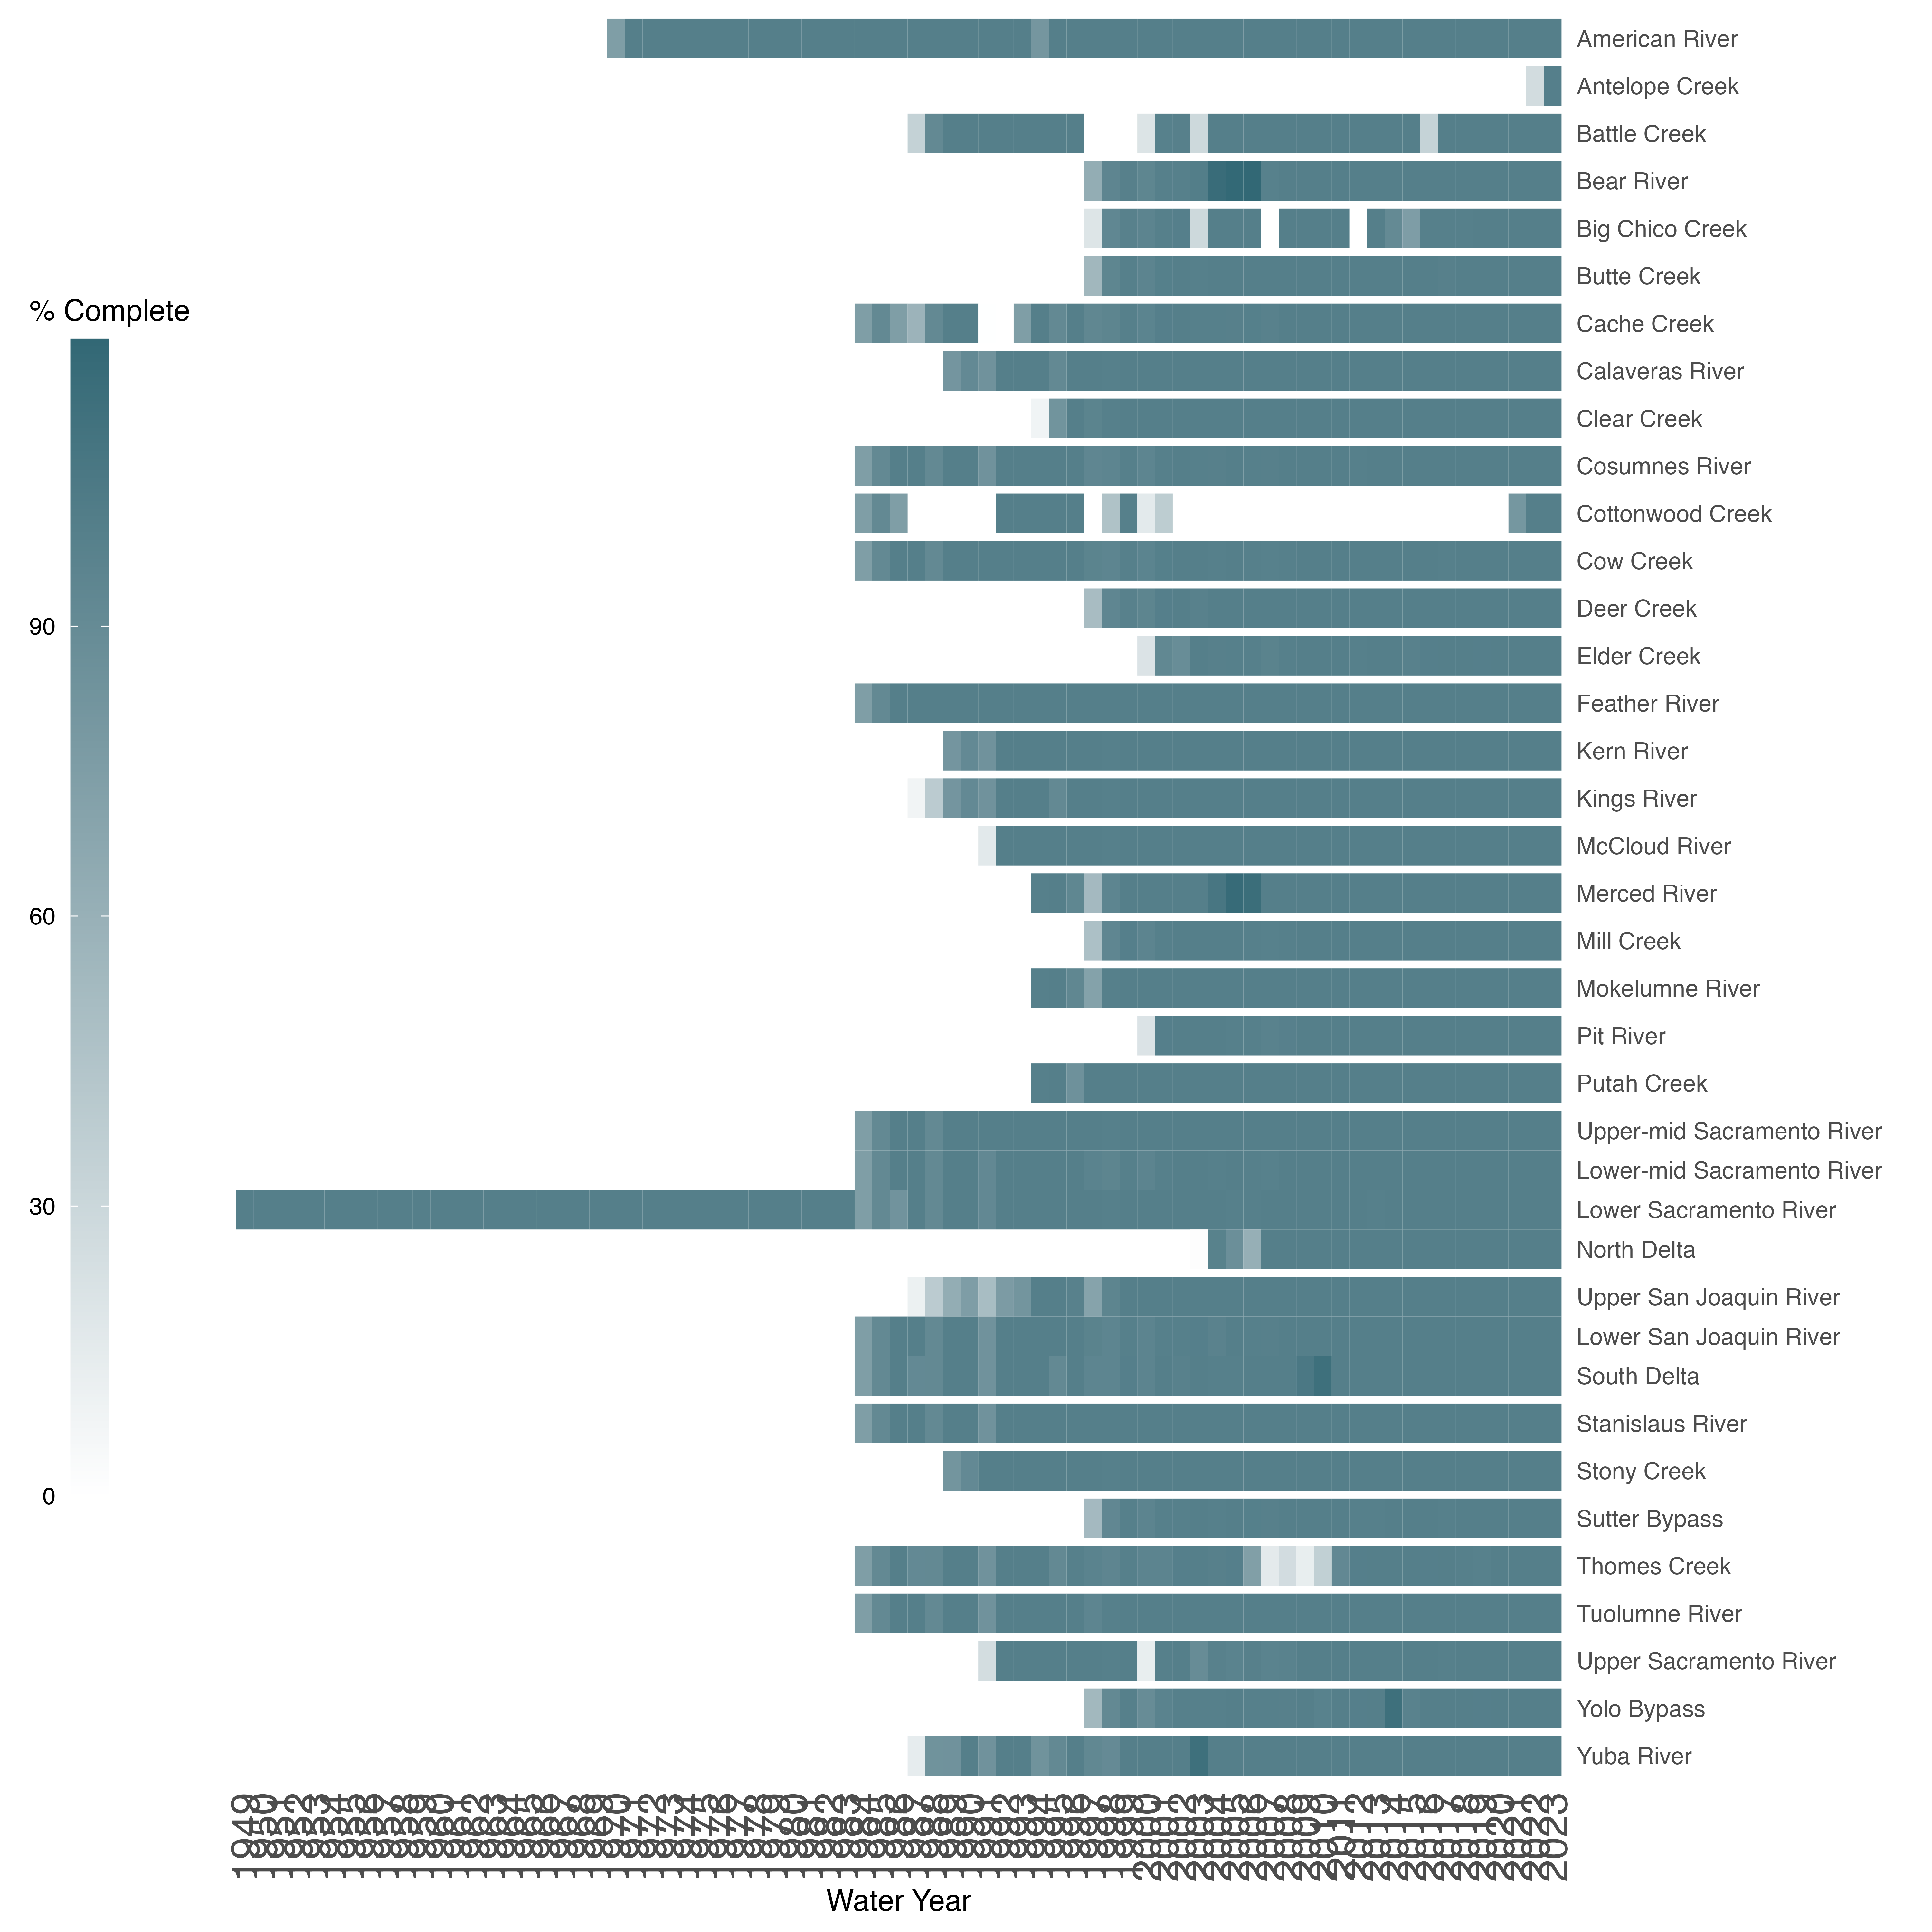
Temporal Coverage
Sensor date ranges
The following chart summarizes the ranges of data availability. This is based on the published start and end dates and does not account for NA values within these ranges. Bear Creek and Paynes Creek are not listed in this figure because no stations are present. Calaveras River is included but data is only available from reservoir outflow.
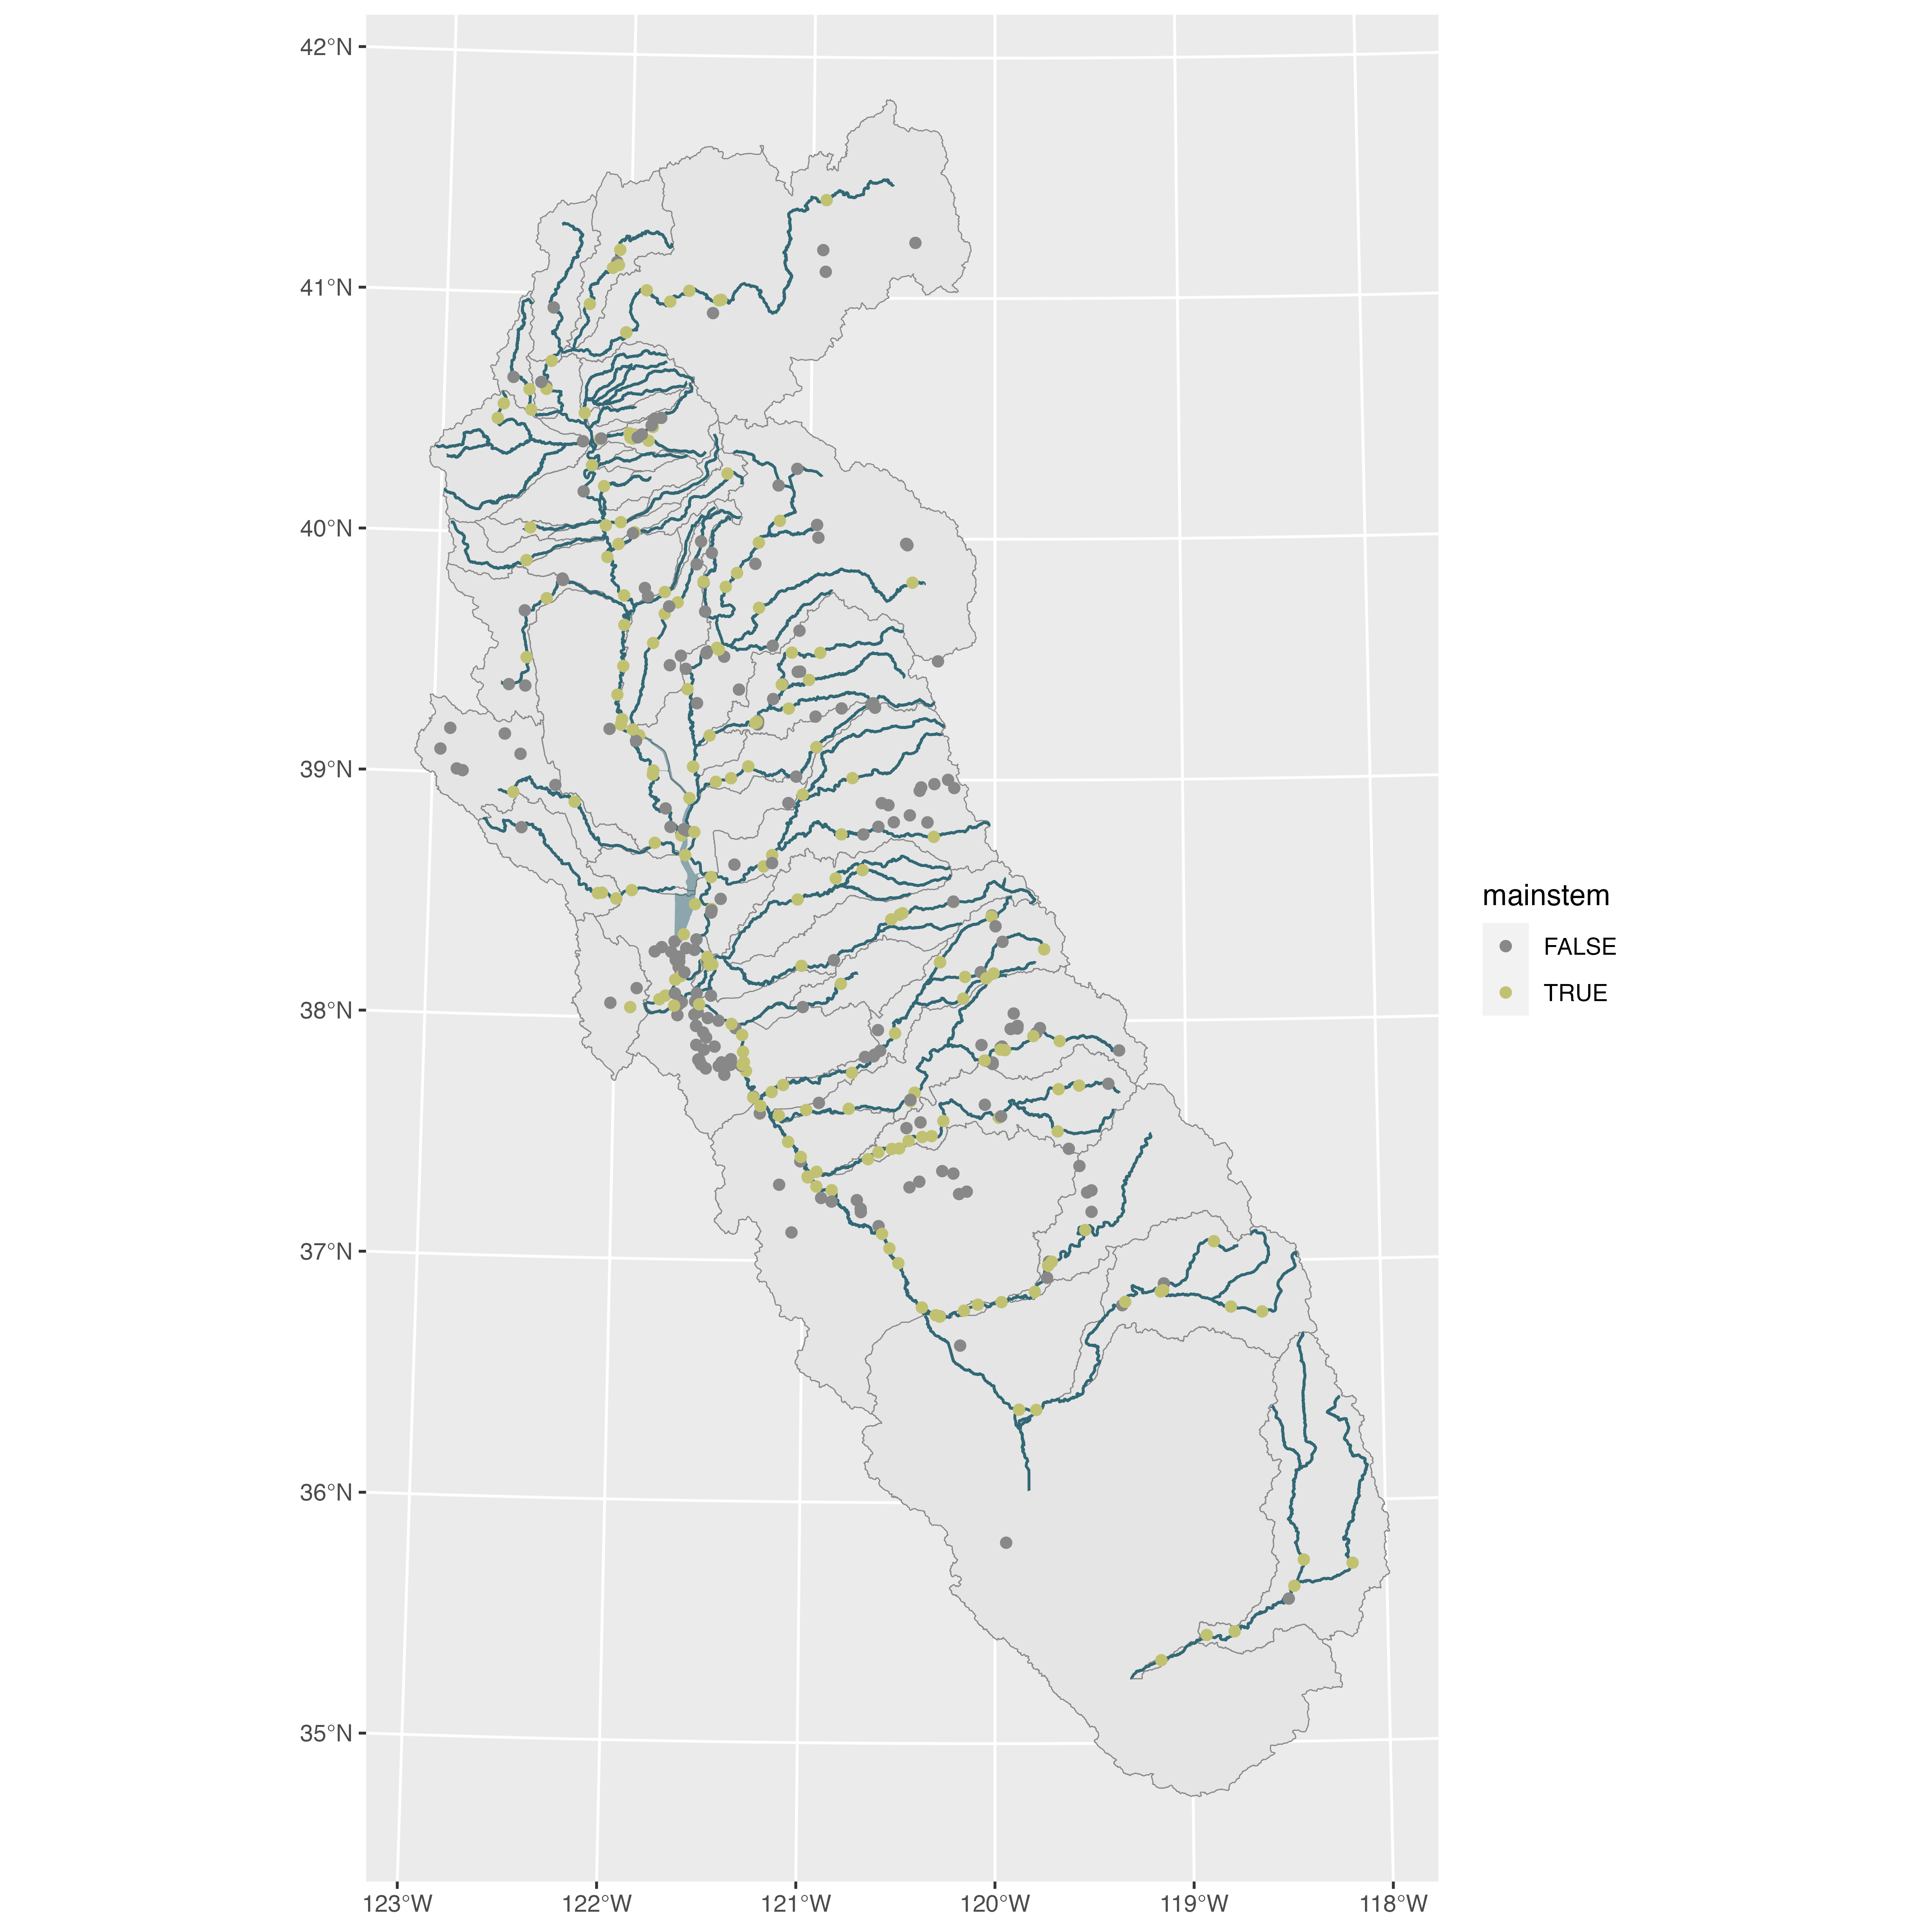
Spatial Coverage
Geographic distribution of sensors
Also shown on this map for context are in-stream flow sensors on tributaries and secondary channels, as well as canal diversions and reservoir outflow gages.
Years of data available by stream
The following map illustrates the data availability length by stream. This is based on the published start and end dates and does not account for NA values within these ranges.
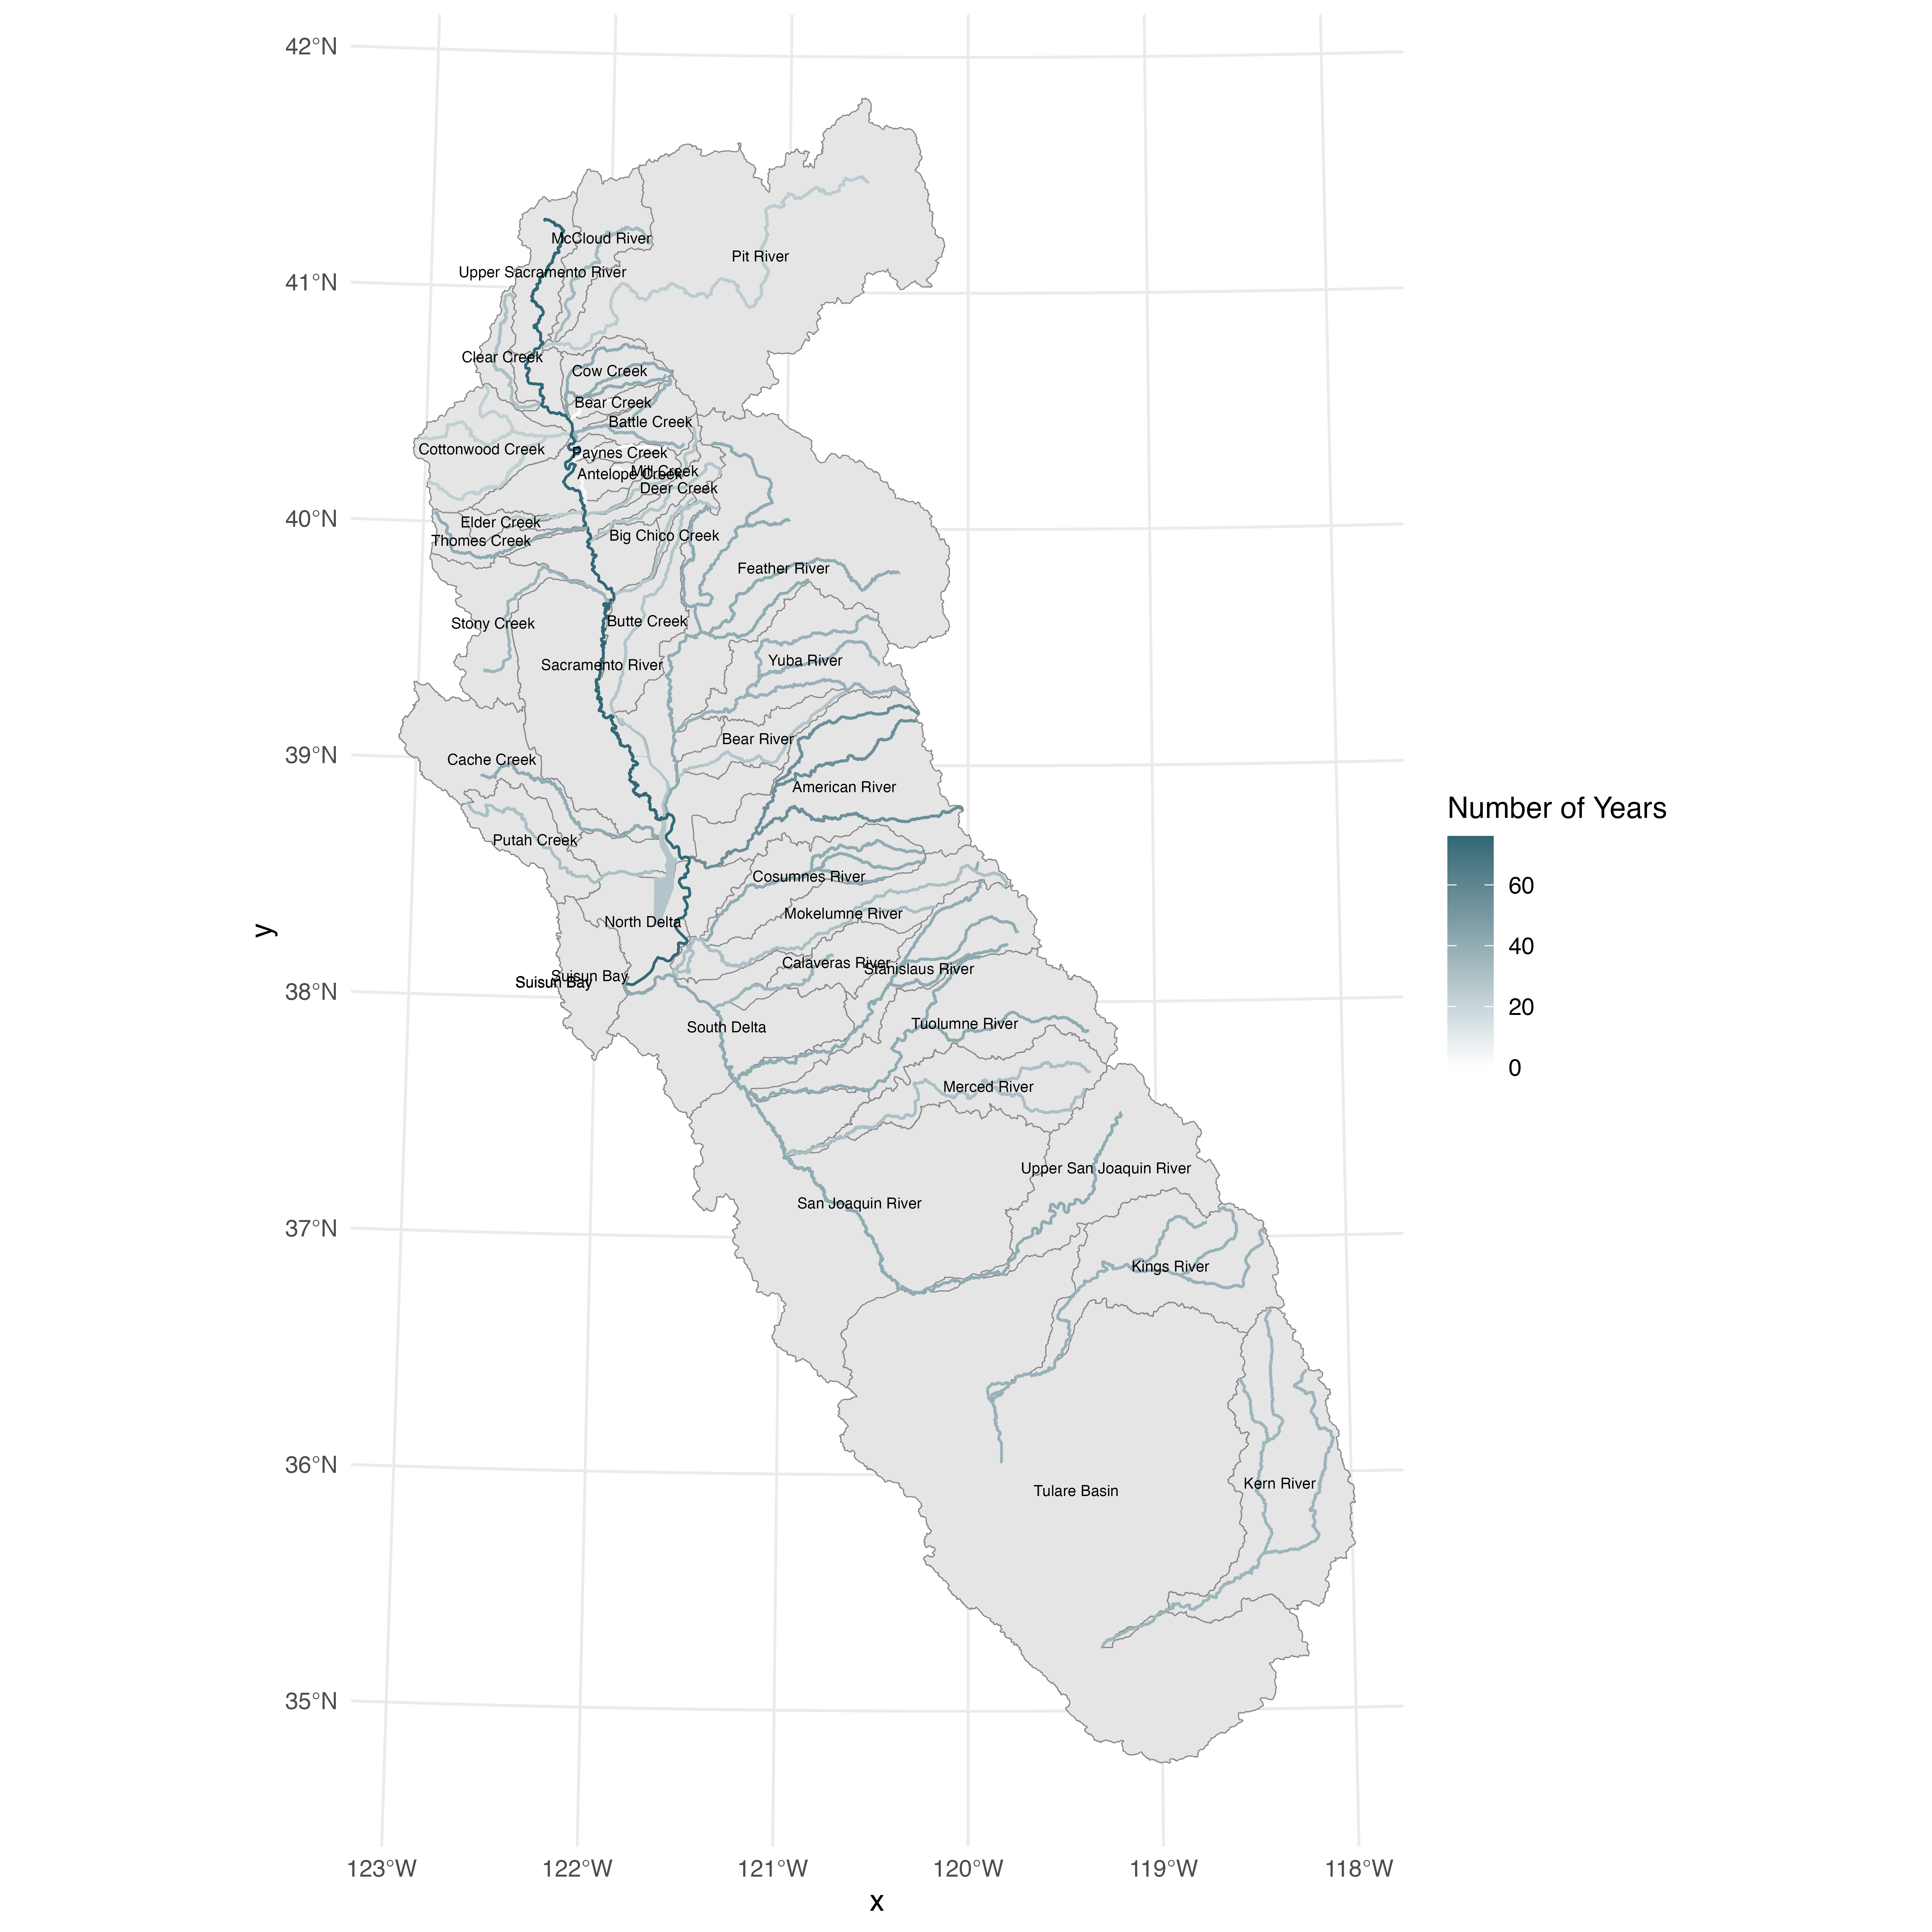
Summary statistics indicating the proportion of major streams that are gaged at various time points.
| Year | Percent of Data |
|---|---|
| 1949 | 2.5 |
| 1984 | 35.0 |
| 1997 | 85.0 |
| 2015 | 92.5 |
| 2022 | 95.0 |
Quality Checks
What quality assurance/quality control checks are implemented by monitoring agency?
CDEC is a secondary data provider. QA/QC is conducted individually by the agencies that collect data. No QA/QC is conducted by CDEC with the exception of applying the following standard error codes:
Error codes
Flow data include the following error codes when downloaded direct from CDEC using the CSV servlet.
-
-9998= Below Rating Table* -
-9997= Above Rating Table* -
m= missing value
*According to the CDEC FAQ: “River flow data for stations with river stage data are computed using a specific rating table/rating curve for each particular station. When the river stage is above or below the available rating table, a flow cannot be computed.”